Charts

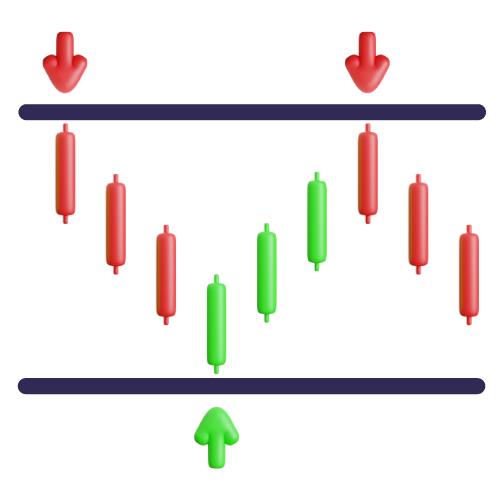
Support and Resistance Zones
When the price rises and then retraces, the highest point reached before the retracement becomes resistance, showing potential seller interest. Conversely, the lowest point reached before a continuation upward becomes support, showing possible buyer interest. These levels evolve as the price fluctuates.
Support and resistance levels should not be viewed as absolute. Instead, identify areas of potential significance and adapt your strategy accordingly.
Tip: Line charts (showing only closing prices), help identify zones more accurately than candlestick charts. Extreme highs and lows in candlesticks can mislead. Look for multiple peaks or valleys on line charts to plot support and resistance lines.
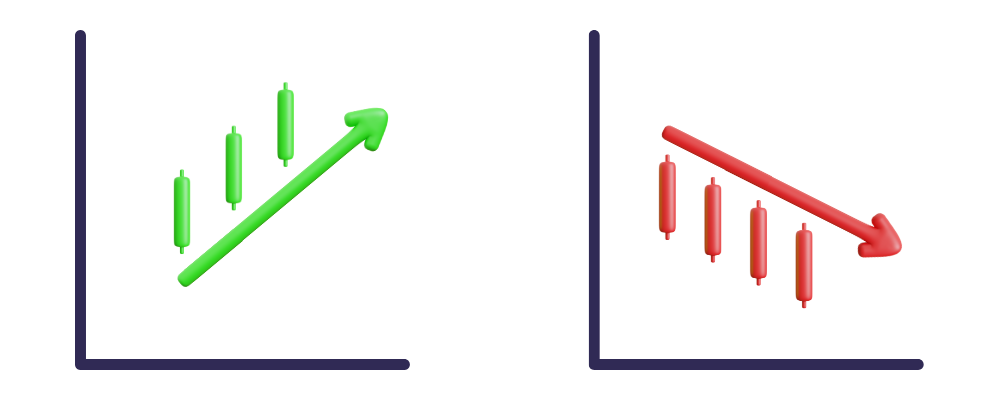
Trend Lines

These lines indicate market trends and potential support/resistance levels. To create them, draw an ascending line along valleys for uptrends and a descending line along peaks for downtrends. Uptrends exhibit higher lows, while downtrends show lower highs; sideways trends represent ranging. Ensure confirmation with at least three points for validity, as repeated tests reinforce trend lines. Remember, don't manipulate lines to match the market; if they don't naturally align, they're not valid.
Tip: Steeper lines will be less dependable.

Trend Channels
Trend channels are an extension of trend lines, created by constructing parallel lines drawn alongside an existing trend. To form an ascending channel, draw a parallel line that matches the angle of an uptrend line and then position it to touch the recent peak. Similarly, for a descending channel, align a parallel line with the downtrend angle to touch the recent valley. The upper line indicates resistance, while the lower line acts as support, revealing potential areas for key market levels.
*Don't be concerned if your channel isn't perfectly parallel, as price patterns often deviate from perfection and might not always align precisely within the channel boundaries.
Psychological Patterns
Psychological levels are among the easiest patterns to recognize because they are based on simple and widely understood price levels. These levels typically involve round numbers or significant price points that traders commonly pay attention to. Traders tend to react strongly around these levels, leading to increased buying or selling activity.
Become An Expert Trader
Unlock the art of strategic investing with Chart Craft! Decode charts, spot trends, and invest smartly for consistent profit. Join our community today.
75.00 USD / month
Thank you for your purchase
Have a great day!