Indicators

Moving Averages
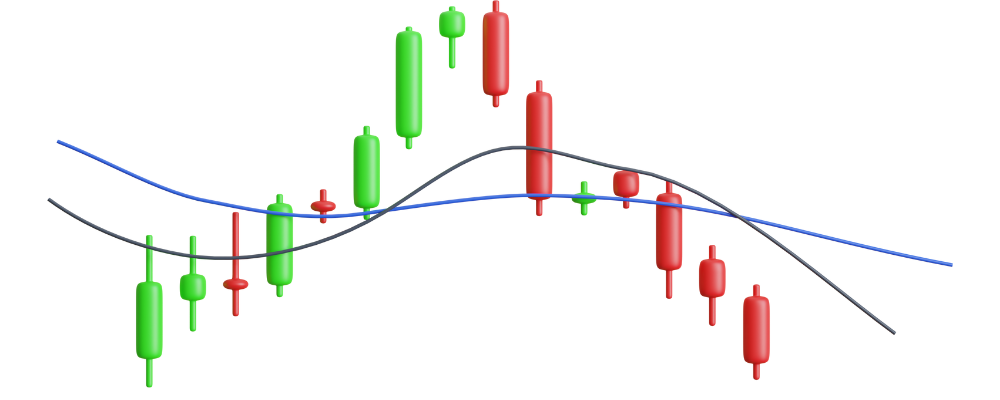
In trading and investing, moving averages are vital for trend analysis and noise reduction. These indicators calculate an asset's average closing price over a set number of past periods. To gauge the trend, a straightforward method is to plot a single moving average on the chart. When prices consistently remain above this line, it signals an UPTREND. Conversely, when prices consistently stay below, it indicates a DOWNTREND.
There are two main types of moving averages:
- Simple Moving Averages (SMA): straightforward to calculate and provide a broader view of recent and future short-term price actions. However, they can be susceptible to false signals during price spikes.
- Exponential Moving Averages (EMA): give more weight to recent periods, enabling them to respond quickly to market changes. Short-period EMAs are excellent for capturing early trends, but they might generate misleading signals during consolidation periods.
Tip: Use moving averages as dynamic support and resistance levels. They adjust based on recent price action, making them valuable for traders.

MACD
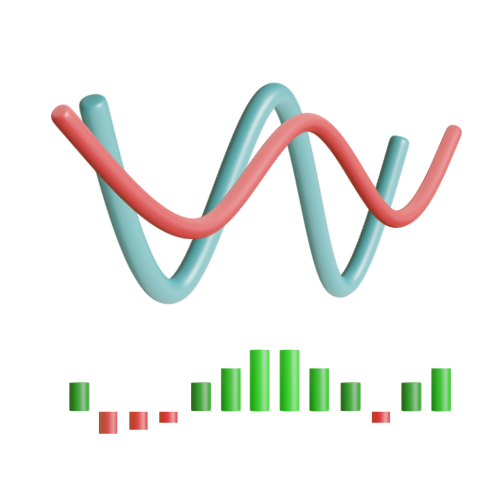
MACD stands for Moving Average Convergence Divergence. It's a vital tool in trading used to spot trends, whether they're bullish or bearish. The MACD chart usually comprises of three essential elements:
- The MACD Line represents the difference between two exponential moving averages (EMAs), typically a short-term EMA and a long-term EMA.
- The Signal Line is a moving average of the MACD Line, it smoothens out the MACD Line's fluctuations, making it less sensitive to short-term price movements.
- The Histogram visually demonstrates the gap between the MACD Line and Signal Line, signaling divergence (when they move apart) or convergence (when they get closer).
One common strategy is to watch for crossovers between the MACD Line and Signal Line. When the MACD Line crosses above the Signal Line, it's seen as a bullish signal, suggesting a potential uptrend. Conversely, when the MACD Line crosses below the Signal Line, it's considered a bearish signal, indicating a potential downtrend. Additionally, traders monitor the Histogram for changes in size. A larger Histogram suggests divergence and a possible trend reversal, while a smaller Histogram implies convergence and a continuation of the current trend.

Relative Strength Index
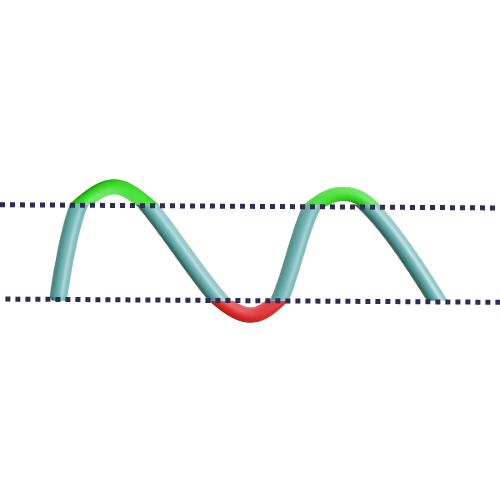
Traders use the RSI to make decisions about entering or exiting trades and assessing the overall strength of an asset's trend. RSI ranges from 0 to 100, with readings below 30 indicating oversold conditions and a potential for price increases, making it a buying opportunity. Conversely, readings above 70 suggest overbought conditions and the possibility of price declines,
signaling a selling opportunity. Traders also watch for centerline crossovers: RSI moving from below 50 to above it suggests a strengthening uptrend, while moving from above 50 to below it indicates a weakening downtrend. If you're anticipating an uptrend, check that RSI is above 50, and for a downtrend, ensure RSI is below 50.
Become An Expert Trader
Unlock the art of strategic investing with Chart Craft! Decode charts, spot trends, and invest smartly for consistent profit. Join our community today.
75.00 USD / month
Thank you for your purchase
Have a great day!