Candle Anatomy
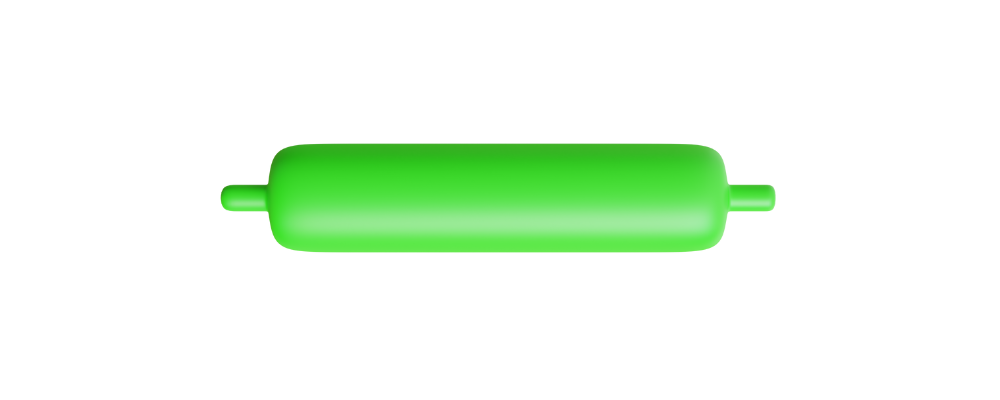
Body
- The length of the candlestick's body indicates the strength of buying or selling pressure.
- Longer bodies suggest intense pressure, where either buyers (bulls) or sellers (bears) took control.
- Short bodies, on the other hand, reveal minimal activity.
- Long green candlesticks portray buying pressure, with the close well above the open.
- Conversely, long red (filled) candlesticks showcase selling pressure, with the close considerably below the open.
Wicks
- Upper wicks denote the session high, while lower wicks indicate the session low.
- Candlesticks with long wicks reveal trading activity extending well beyond the open and close, while those with short wicks indicate trading near the open and close.
- A candlestick with a long upper wick and short lower wick shows an initial price increase followed by sellers driving prices back down, ending near the open.
- Conversely, a candlestick with a long lower wick and short upper wick suggests an initial price decline followed by buyers pushing prices back up, closing near the open.
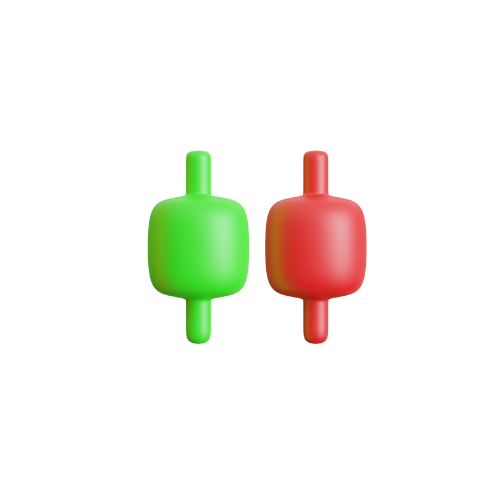
Spinning Top
- Small real body.
- Long upper and lower wicks.
- Neutral.
Indecision between buyers and sellers, suggesting exhaustion and possible trend reversal.

Green Marubozu
- Long green body.
- No wicks.
- Bullish.
Implies bullish control and often marks a bullish continuation or reversal in downtrends.
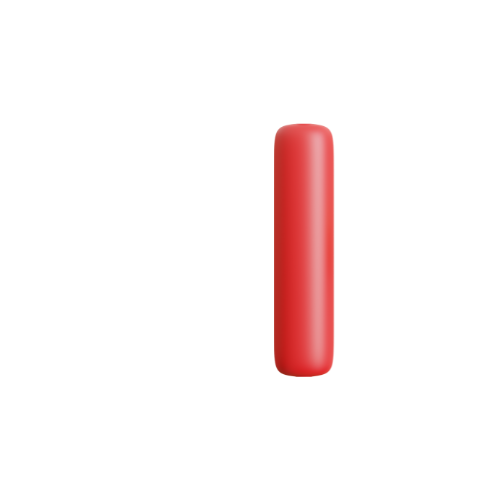
Red Marubozu
- Long red body.
- No wicks.
- Bearish.
Indicates bearish dominance and often signals bearish continuation or reversal in uptrends.
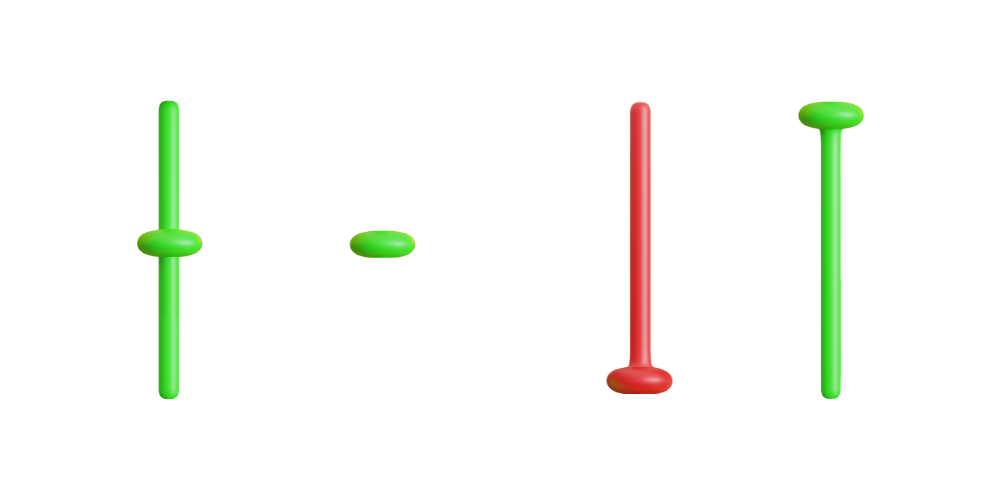
Doji
- Varying upper and lower wick lengths resulting in cross or plus sign patterns.
- Same open and close price or extremely short bodies, often appearing as thin lines.
When a Doji emerges, pay attention to preceding candlesticks. After a series of green-bodied candles, a Doji signals buyers' exhaustion. Conversely, if a Doji follows a sequence of long red bodies, sellers might be weakening.
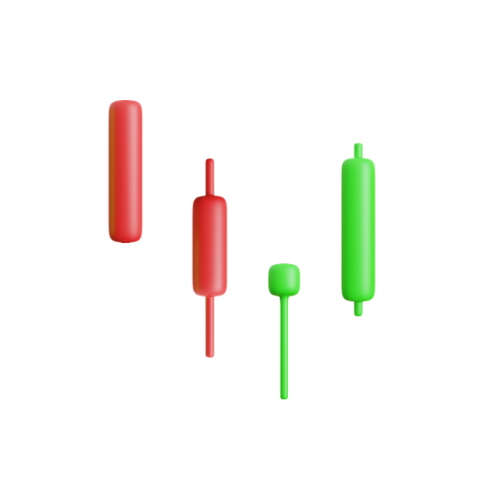
Hammer
- Small body.
- Lower wick 2-3 times length of body.
- No or short upper wick.
- Occurs in downtrend.
- Bullish.
As prices decline, the hammer suggests an upcoming price increase, with buyers countering selling pressure and resulting in a close near the open.
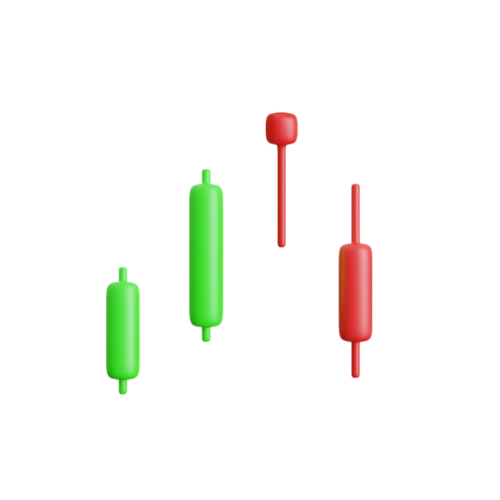
Hanging Man
- Small body.
- Lower wick 2-3 times length of body.
- No or short upper wick.
- Occurs in uptrend.
- Bearish.
It shows downward price pressure as sellers begin to outnumber buyers. Although buyers counteract the decline, their efforts only lead to a marginal recovery near the opening price.
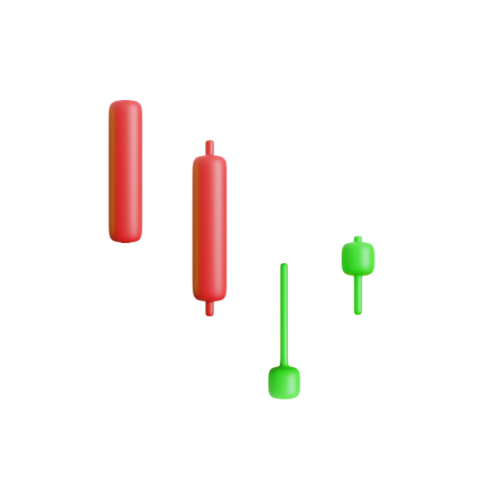
Inverted Hammer
- Small body.
- Upper wick 2-3 times length of body.
- No or short lower wick.
- Occurs in downtrend.
- Bullish.
Signals increasing buyer influence. Though sellers attempt to push prices back down, buyers manage to close the near the open.
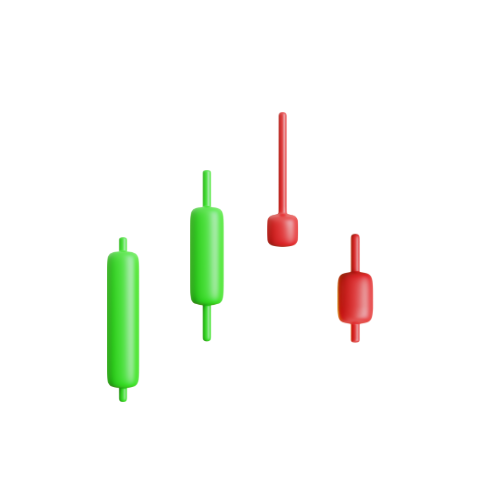
Shooting Star
- Small body.
- Upper wick 2-3 times length of body.
- No or short lower wick.
- Occurs in uptrend.
- Bearish.
This indicates that buyers initially pushed the price up, but their efforts were outweighed by sellers who took control.
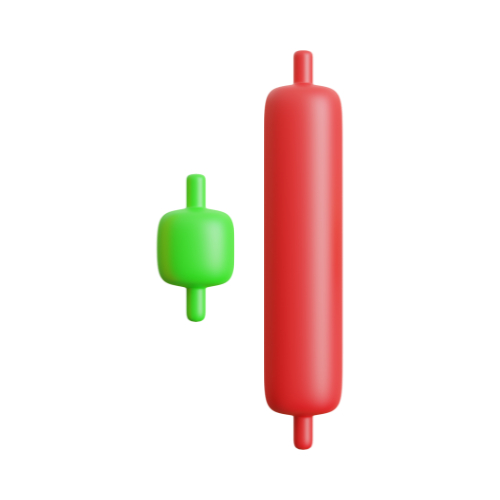
Engulfing Candle
- A smaller candle is followed by a larger candle that is opposite the trend, effectively “engulfing” the previous.
Bullish engulfing candles suggest that buyers are stepping in, signaling a potential upward movement following a downtrend or consolidation phase. Conversely, a bearish engulfing candle indicates sellers have overwhelmed buyers with a potential strong downward movement next.
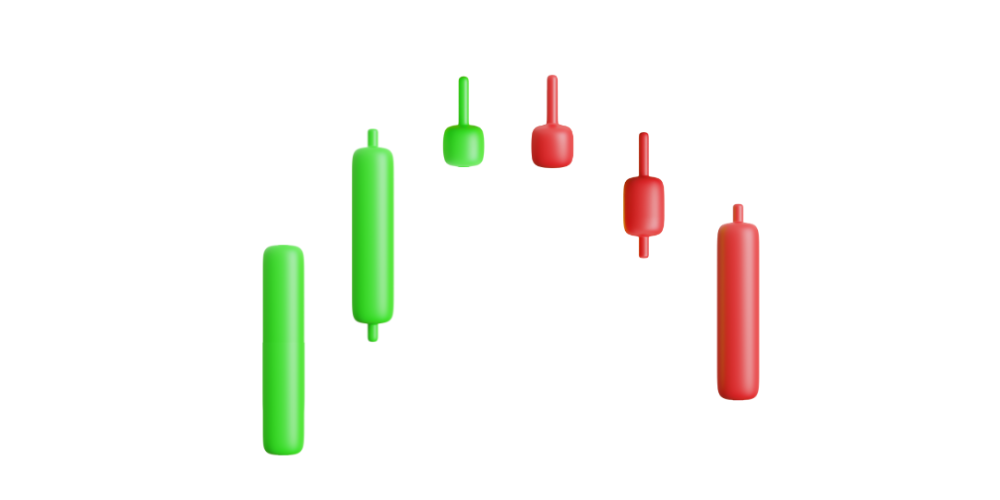
Tweezer Candles
- Occurs during extended uptrends or downtrends, signaling an impending reversal.
- The candlestick wicks should create a resemblance to tweezers, with Tweezer Tops having near-equal highs and Tweezer Bottoms having near-equal lows.
This pattern involves two candlesticks—the first candle aligning with the trend and the second candle opposing it.
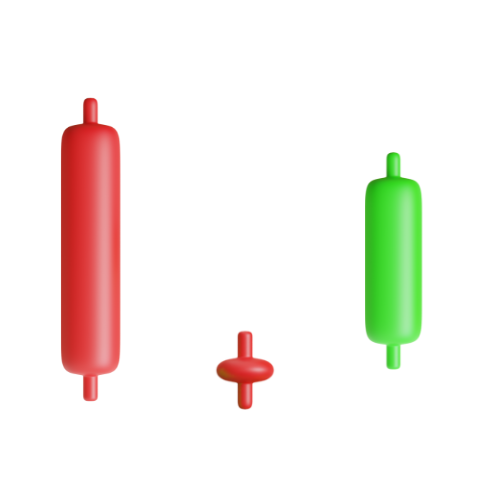
Morning Star
- Occurs at the end of a trend.
- Bullish.
Begins with a bearish candle, followed by a small-bodied candle signifying uncertainty, and concludes with a bullish candle that closes above the first candle's midpoint
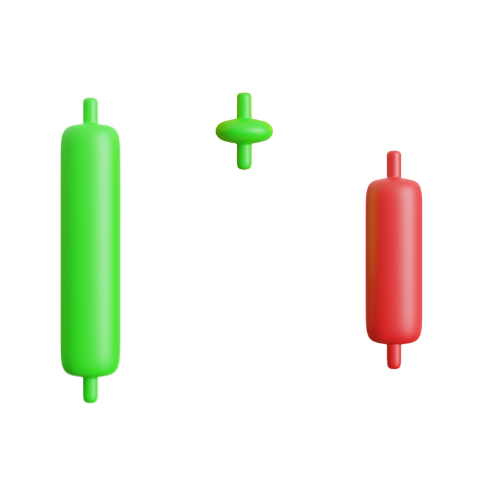
Evening Star
- Occurs at the end of a trend.
- Bearish.
Begins with a bullish candle, followed by a small-bodied candle, and concludes with a bearish candle that closes below the first candle's midpoint.
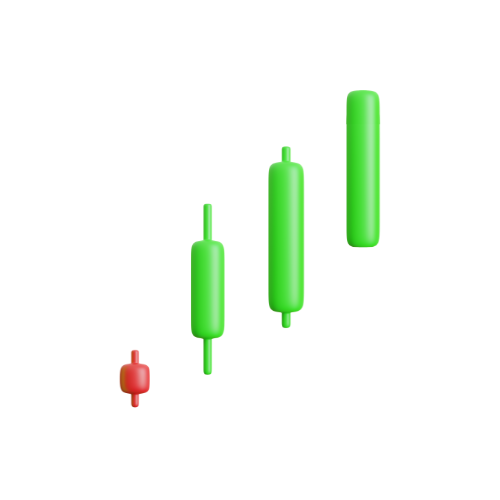
Three White Soldiers
- Occurs in extended downtrends or short consolidation periods.
- Minimal upper or lower wicks in the second and third candles strengthens the pattern's significance.
- Bullish.
Three consecutive green candles are formed, each opening higher than the previous close and closing near their highs.
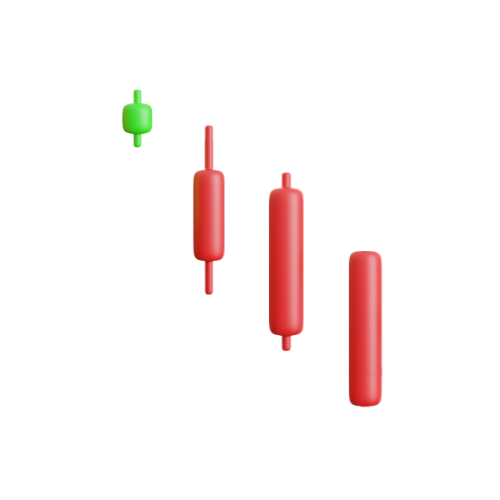
Three Black Crows
- Occurs at the end of a strong uptrend.
- Minimal upper or lower wicks in the second and third candles strengthens the pattern's significance.
- Bearish.
Three consecutive red candles are formed, each opening higher than the previous close and closing near their lows.

Three Inside Up/Down
- Signifies a potential reversal
It involves three candles: a first candle following the trend, a second candle that covers or exceeds the midpoint of the first candle, and a third candle that closes beyond the high or low of the first candle.
Become An Expert Trader
Unlock the art of strategic investing with Chart Craft! Decode charts, spot trends, and invest smartly for consistent profit. Join our community today.
75.00 USD / month
Thank you for your purchase
Have a great day!